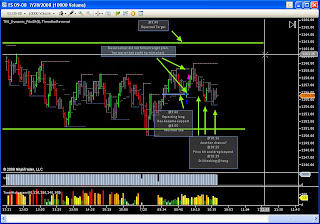
What's the relationship between price and S/R? These are key areas to look for. On hindsite we can tell how price react to earlier S/R. Question is how to trade them in real time?
Another clue that Stealth Trader mentioned is momentum, that could help.
My trading journey. Now inclined to AHG style of trading, without indicator. This is very similar to what DBPhoenix advocate - The Wyckoff style of trading. Accuracy is of no concern, but expectancy is.
Thursday, 31 July 2008
Wednesday, 30 July 2008
ES 20080730
Why price stall below the line?
4 types of ppl in the market.
1. Those that've shorted the break out weeks back : worry of turning a winner to looser, buy to BE.
2. Those holding long position @ this support level weeks back : buyers who purchase near a support level, only to see price fall, are likely to sell in order to recover their losses, when price rallies to near their break-even point.
3. Those holding long position @ lower level : seeing S turn R, will sell to take profit
4. Those not in trade : with the notion of Support becomes resistance, start to sell.
Labels:
Trades
Tuesday, 29 July 2008
Monday, 28 July 2008
ES 20080728
Droping all indicators, well, not all but most. :) Trying to follow only Price action with Support/Resistance, looking at how price behave when it reaches S/R.
Labels:
Trades
Sunday, 27 July 2008
Price Action Journal
Found a new Journal focusing on Price Action. Susan is from Anek camp. Will be nice following this, entry using 3BR. Price Action Journal
Labels:
Trading Strategy
Tuesday, 8 July 2008
Magnitude of trade
Two charts here, the first is trading within a range of 50 ticks. Entries has target of 10 ticks and stops ~ 10 ticks.
2nd chart has a much bigger range. In fact the day range of YM. Trading this chart will have a stop of ~30 ticks and target of ~80 ticks.
Which is better???
2nd chart has a much bigger range. In fact the day range of YM. Trading this chart will have a stop of ~30 ticks and target of ~80 ticks.
Which is better???
Labels:
Trading Strategy
Thursday, 3 July 2008
Wednesday, 2 July 2008
Trading Plan
Follows jjrvat style of scalping with AHG tweek. Seeing beauty in both methods. Lets see hows this works out. Key points are
1. follows general direction (macro oscillation) of MA240.
2. trades only waves (minor oscillation) thats follows macro osc.
3. pay attention to Market Emotion. the 25% 50% 75% lines.
4. pay attention to 50% retracement of previous minor osc. (TRO_fib)
5. use AHG color bar as entry trigger.
1. follows general direction (macro oscillation) of MA240.
2. trades only waves (minor oscillation) thats follows macro osc.
3. pay attention to Market Emotion. the 25% 50% 75% lines.
4. pay attention to 50% retracement of previous minor osc. (TRO_fib)
5. use AHG color bar as entry trigger.
Labels:
Trading Strategy
Looking at the chart, it is very obvious that we're not capturing the correct move with V250 chart
It looks better with the V500 chart.
Labels:
Trading Psychology,
Trading Strategy
No time Trading
Didn't have time to monitor market during trading hour.
will post observation after event.
Hope this will be as good a learning experience.
will post observation after event.
Hope this will be as good a learning experience.
Labels:
Random Thoughts
Subscribe to:
Posts (Atom)