Big Picture
My trading journey. Now inclined to AHG style of trading, without indicator. This is very similar to what DBPhoenix advocate - The Wyckoff style of trading. Accuracy is of no concern, but expectancy is.
Thursday, 13 January 2011
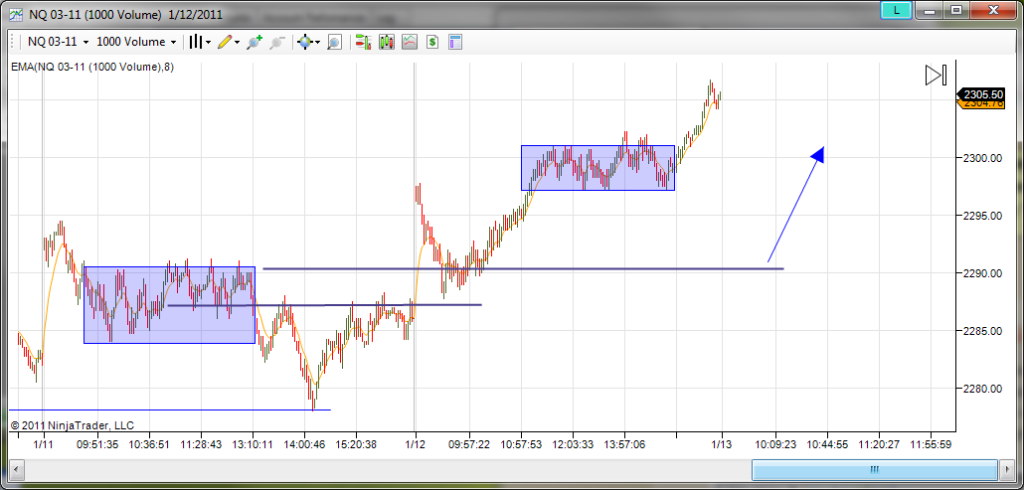
Deep Retrace during market open
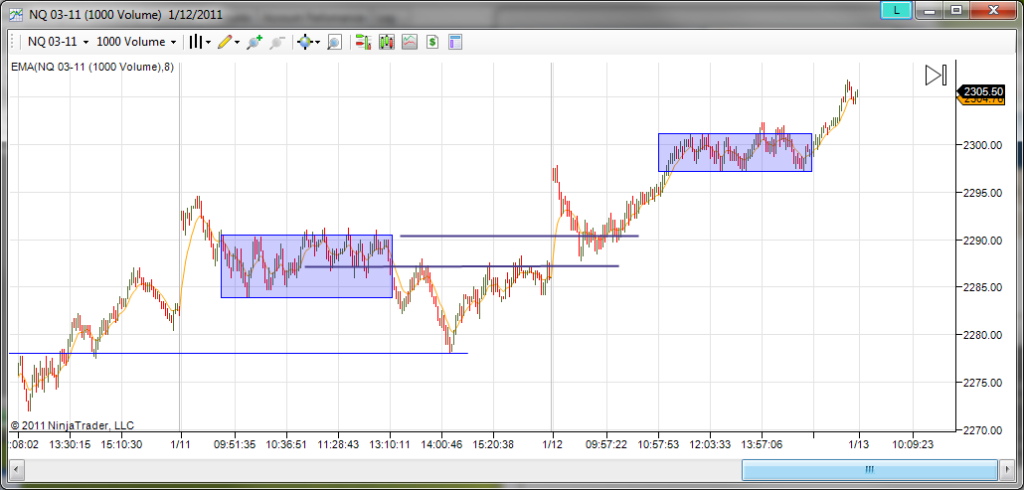
Price drop sharply during market open with heavy volume. Down to mid of zone, price hover around top of zone without good signal for entry.
Price move back above zone before testing top of zone with increase volume, it failed to penetrate the zone and have no follow through as indicate by lack of interest (volume).
Tuesday, 11 January 2011
Not a clear day
Monday, 10 January 2011
NQ Moving higher?
Friday, 7 January 2011
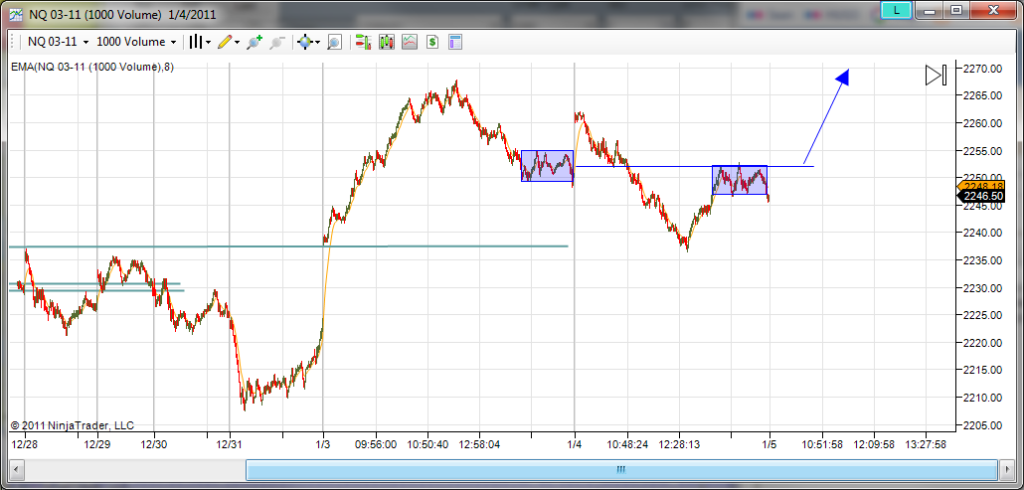
Consolidation or Distribution
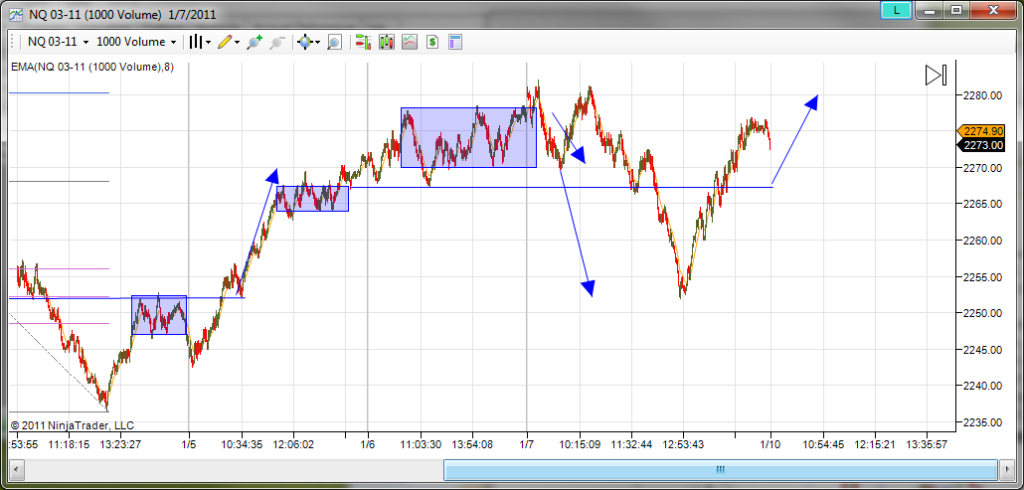
Price moved in a narrow range yesterday. Is this consolidation for a move higher or distribution of gain made over past few days?
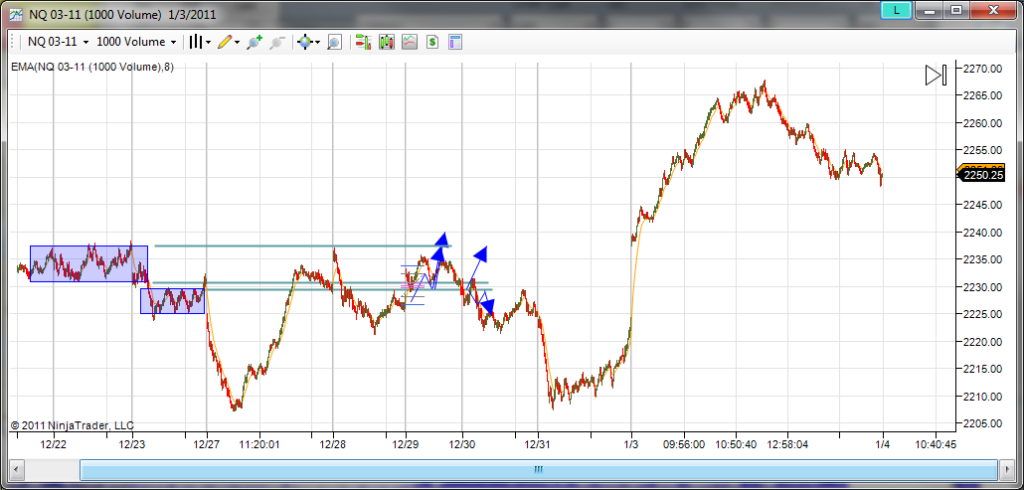
Looking at the week move, lets see what happen when market open.

It's really nice seeing how price react to those zones. The retracement after breaking down 2270 was deep and slow. If you look at time based chart, its a good 45 mins of struggle before price drop down sharply to 2252.
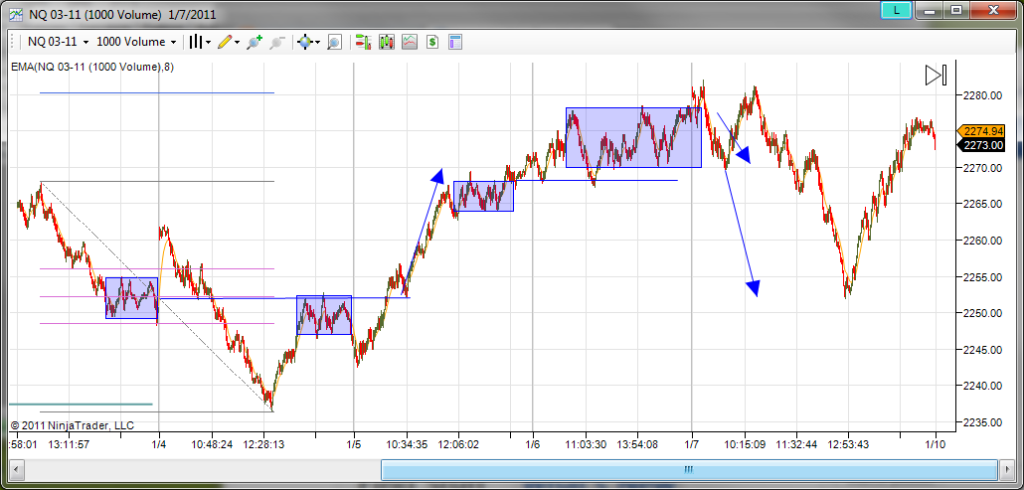
Looking at the week move, lets see what happen when market open.
It's really nice seeing how price react to those zones. The retracement after breaking down 2270 was deep and slow. If you look at time based chart, its a good 45 mins of struggle before price drop down sharply to 2252.
Thursday, 6 January 2011
Dont' like what I see
Wednesday, 5 January 2011
Tuesday, 4 January 2011
This is the Volume
Look at the difference a new year make. Volume on 1st day of 2011 is easily double or tripper that of last few days of 2010. We are back in the game.

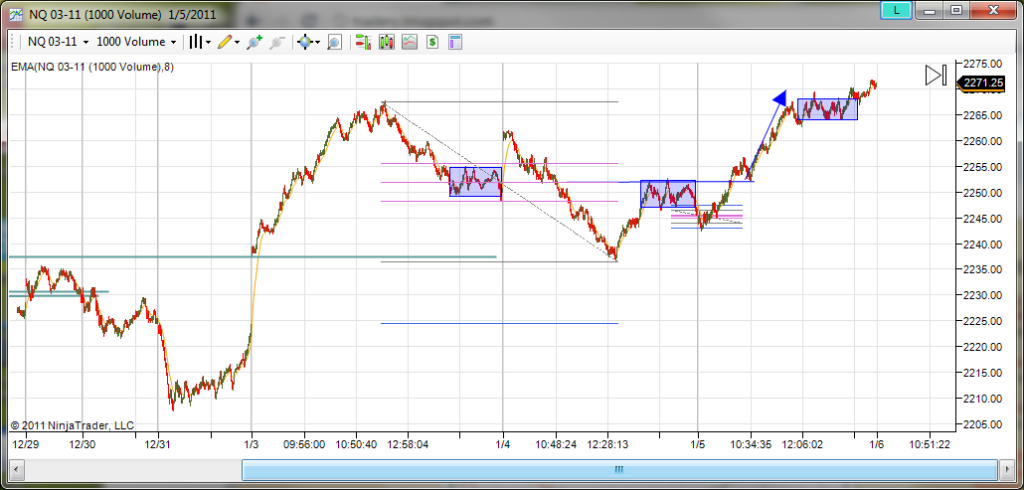
Price jump out of 2237 zone. lets see how price react at the retracement zone

Price gapped up, hover around retracement zone. A quick surge and retrace around 10:24 (Green/red bar) actually form at shooting star testing 61.8 line . Price drop past FE
Price jump out of 2237 zone. lets see how price react at the retracement zone
Price gapped up, hover around retracement zone. A quick surge and retrace around 10:24 (Green/red bar) actually form at shooting star testing 61.8 line . Price drop past FE
Subscribe to:
Posts (Atom)